
If you're like most organizations, you're not short on data. If anything, you probably have more of it than you know what to do with. Reports, forms, documents, spreadsheets, databases, and images pile up every day. And yet, when it comes time to make important decisions, you may still find yourself relying on gut feel or backward-looking reports that explain what already happened instead of what is happening right now.
The real issue is not how much data you have. It's how visible and usable that data actually is. When work happens on paper, in disconnected spreadsheets, or inside files that never make it into your systems, blind spots start to form. In this article, we’ll explore techniques to eliminate these blind spots so that you can see the answers that have been sitting right in front of you the whole time.
Why Instinct Alone Doesn't Scale
Experience and intuition still matter. Expert knowledge often helps you spot problems early or make tough calls when the data is incomplete. But when organizations lean too heavily on gut feel, especially in the presence of reporting gaps and disconnected systems, it becomes harder to use data-driven insights to make informed decisions. Over time, that reliance becomes a constraint, limiting visibility and reinforcing decisions based on partial or outdated information.
As your business grows, complexity grows with it. More customers, more systems, more handoffs, and more variability quickly overwhelm even the most experienced teams. No single person, no matter how capable, can realistically keep track of everything happening across the organization in real time. At the same time, much of your most valuable institutional knowledge remains locked inside people’s heads, shaped by years of hands-on experience but inaccessible to the data-powered tools that are actually capable of analyzing information at scale. The result is a widening gap between what your experts know and what your systems can act on.
To close this gap, forward-thinking organizations are exploring ways of transferring all this institutional knowledge into a series of AI-powered data agents. Over time, the agents become increasingly intelligent as they continuously analyze operational data from systems like ERP and CRM. Instead of relying on periodic reports or individual judgment, these new data agents can monitor processes in real time, recognize patterns, and surface insights that reflect how the business actually runs on a day-to-day basis.
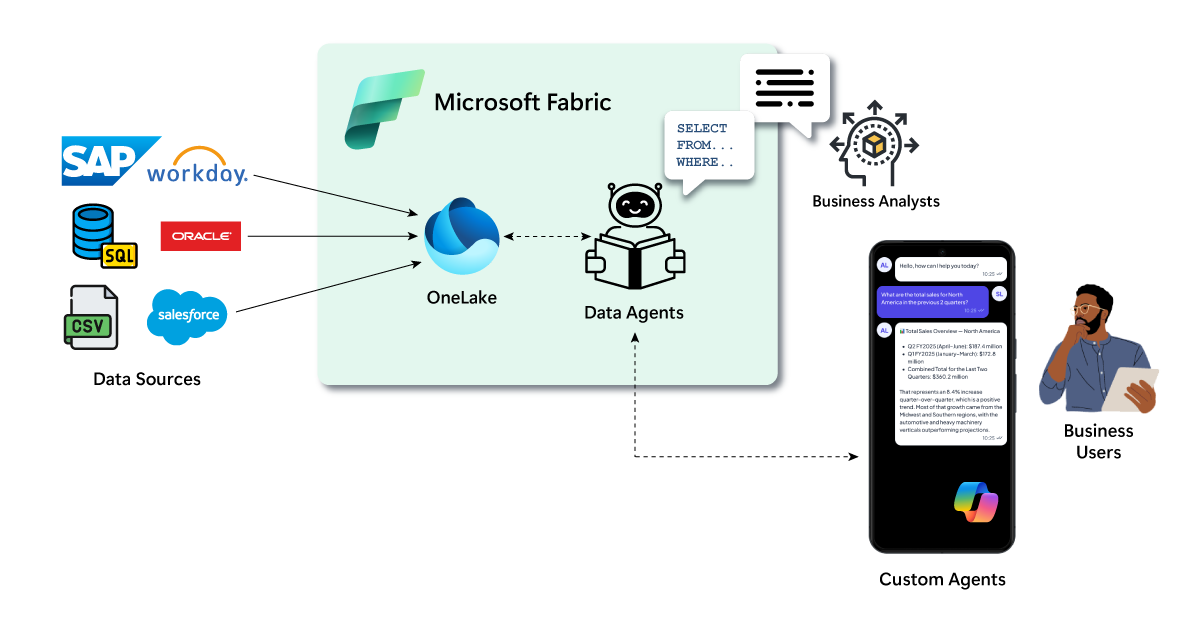
Figure 1: Training AI-Powered Data Agents to Capture Institutional Knowledge
At the end of the day, the most effective teams don't replace instinct with data or automation. Instead, they extend it. Data agents give your instinct memory, reach, and consistency. They help you turn your hard-won experience into a shared, always-on capability that continuously learns from operational data and supports better decisions at scale.
If It’s Not in the System, It Didn’t Happen
Every organization has them. The paper forms clipped to a clipboard on the shop floor. The Excel file someone built years ago that now runs a critical process. The Access database that only one person really understands. You know, those “temporary” workarounds that somehow became permanent.
None of these tools are inherently bad. In many cases, they were created to solve a real problem quickly in order to keep work moving. Unfortunately, every time this happens, line of sight on operations is compromised.
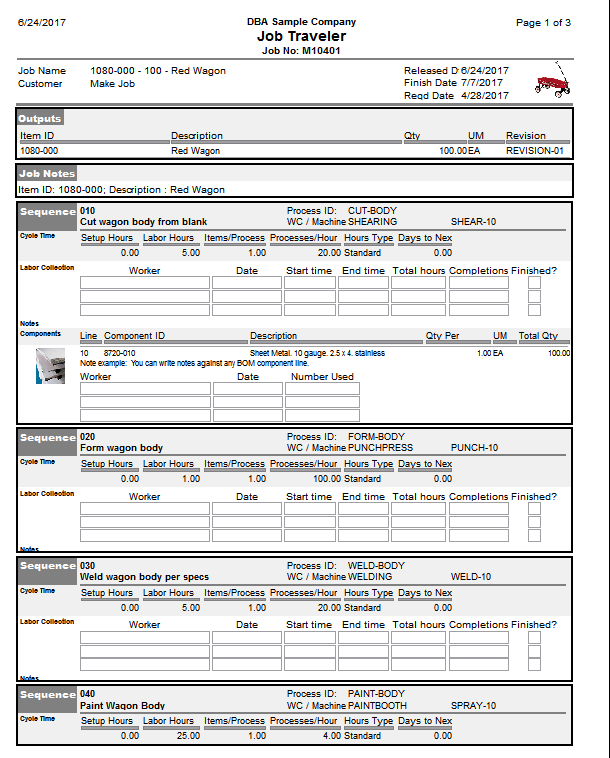
Figure 2: Useful Information Locked Up in a Job Traveler Form
When work happens outside your core systems, it becomes invisible. Management dashboards only show what the system can see, not what's actually happening. Meanwhile:
Cycle times appear shorter than they really are.
Bottlenecks remain hidden.
Exceptions never make it into reporting.
Anomalies are chalked up to one-off issues instead of patterns.
Shadow IT and manual documentation can create an illusion of control. You feel like the process is documented because the results are saved on a hard drive or stored in a file cabinet. You feel like performance is measurable because there's a report. However, if the underlying work is being tracked in parallel tools that aren't connected to your operational systems, you're really only seeing part of the story.
Over time, this fragmentation severely limits your ability to improve. Process telemetry is the foundation of continuous improvement. It captures who did what, when, and under what conditions. It reveals friction, delays, and anomalies in real time. But telemetry only works when the process is instrumented inside the system of record. When work happens in the shadows, your metrics are incomplete and your conclusions are often wrong. And you certainly can't build intelligent automation or data agents on top of disconnected processes.
The bottom line is this: if the results of a process aren't recorded in the system, it's as if it never happened at all from a measurement and optimization standpoint. And when meaningful work lives outside the line of sight, so do the insights that could help you eliminate bottlenecks, reduce waste, and make better decisions.
Data Doesn’t Have to Be Structured to Be Useful
For years, organizations have stored unstructured files like Word documents, PDFs, scanned forms, images, emails, and videos in content repositories or data lakes. These systems were designed for storage and retention, not for insight. Over time, many of these repositories quietly turned into digital graveyards. Files were archived for compliance or recordkeeping purposes, but they were rarely revisited, analyzed, or used to inform decisions again.
In many cases, these are missed opportunities. Modern data platforms now provide low-code and AI-powered tools that can extract meaningful information from unstructured and semi-structured content. Documents can be scanned and parsed. Key fields can be identified and tagged. Images can be analyzed for defects or compliance issues. Even video files can be indexed and searched for specific events or behaviors. What used to require custom development or expensive data science teams is now increasingly accessible to business teams through configurable tools and prebuilt AI models.

Figure 3: The Untapped Potential of Document Attachments and Media Files
This process, often referred to as "document cracking", allows you to turn files into data. Instead of a PDF sitting in a folder, key details like dates, approval signatures, exception notes, or warranty terms can be extracted and stored in a structured format. Instead of inspection photos being archived and forgotten, they can be analyzed for patterns. Instead of meeting recordings disappearing into storage, action items and decisions can be captured and tracked.
The result is not just more data, but richer context. Some of the most valuable insights in your organization live outside traditional systems of record. They exist in the notes, comments, attachments, and media files that explain why something happened, not just what happened.
You don't have to manually transcribe every document or build a custom AI lab to unlock that value. Today’s platforms make it possible to start small, configure workflows, and apply intelligent extraction at a fraction of the cost and complexity many organizations assume. The barrier to entry is lower than ever. The real risk is continuing to treat unstructured data as if it can't be used.
The Illusion of Data Readiness
Clive Humby once said, “Data is the new oil. Like oil, data is valuable, but if unrefined, it cannot really be used.” It's a powerful analogy, and it still holds up nearly 20 years later. Simply extracting crude oil from the ground does not power a car or heat a home. It has to be refined, processed, and transformed before it becomes useful. The same is true for your data.
Many organizations assume that once data is moved into a data warehouse or data lake, the hard part is over. The thinking goes something like this: We centralized it. We stored it. Now we can use it. But storage isn't the same as readiness. A data lake full of raw extracts from ERP, CRM, and operational systems is still raw. It may be centralized, but it isn't necessarily structured in a way that supports clear reporting, meaningful analysis, or AI-powered decision-making.
It's a bit like handing a box of receipts to an accountant and expecting a fully optimized tax return by the end of the afternoon. The information may technically be there, but it's disorganized, inconsistent, and lacking context. Dates need to be validated. Categories need to be assigned. Duplicates need to be removed. Without that preparation, even the best accountant in the world will struggle to produce accurate, actionable results.
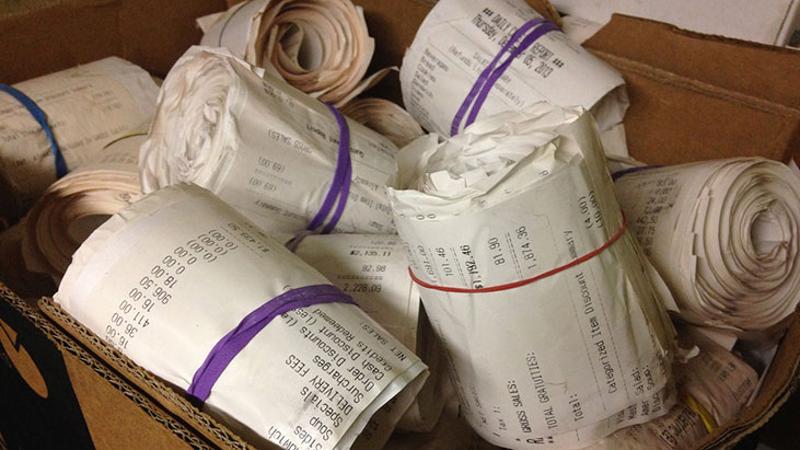
Figure 4: Raw Inputs Don't Produce Refined Outcomes
AI and modern data platforms are incredibly powerful, but they're not a substitute for sound data modeling. Machine learning models and intelligent agents perform best when the underlying data is well structured, clearly defined, and aligned to how the business actually operates. Time spent building dimensional models, establishing clear definitions, creating semantic layers, and aligning metrics to business processes is not overhead, it's refinement.
Just as oil must be refined into fuel before it can power an engine, raw data must be modeled into a form that can power decisions. Dimensional models organize facts and dimensions in a way that makes trends easier to spot. Semantic models ensure that everyone is speaking the same language when they reference revenue, margin, cycle time, or backlog. This structure makes analysis faster, reporting more consistent, and AI more reliable.
What Gets Measured Gets Managed
There’s a reason the phrase “What gets measured gets managed” has endured for decades. Measurement creates visibility. Visibility creates accountability. And accountability creates improvement.
But in many organizations, measurement still depends on manual effort. Across departments, individuals spend precious hours, days, and sometimes even weeks each month pulling data from different systems, reconciling spreadsheets, cleaning up inconsistencies, and assembling operational reports. These data-wrangling activities are often treated as just part of the job. In reality, they’re signs that the underlying process isn’t properly instrumented and that automation is long overdue.
Collecting and organizing process and event telemetry shouldn’t require heroics. When systems are properly integrated and workflows are instrumented, telemetry is captured automatically. You know who did what, when it happened, how long it took, and under what conditions. That level of detail eliminates the need for manual consolidation and gives leadership teams access to accurate, up-to-the-minute dashboards tied to clearly defined KPIs and OKRs.
When those dashboards are reliable and timely, the conversation changes. Instead of debating which spreadsheet is correct, teams can align around a shared source of truth. Instead of waiting for month-end reports, they can monitor trends in near real time. And instead of reacting to surprises, they can identify leading signals and intervene before small issues become larger problems.
Embracing Process Mining and BPM Tools
This is especially powerful when teams sense that something’s wrong but can’t pinpoint why. A department may feel that cycle times are creeping up. Customer service may notice frustration increasing. Operations may suspect bottlenecks are forming. Without detailed telemetry, those concerns remain anecdotes. With well-captured process data, you can trace the issue to a specific step, handoff, or variation in the workflow.
Business Process Management (BPM) and process mining tools build on this foundation. By analyzing event logs from your systems of record, they reconstruct how work actually flows through the organization. They reveal delays, rework loops, and deviations from the intended process. Instead of relying on static flowcharts or manually assembled reports, you gain a dynamic, data-driven view of how your business truly operates.
The technology to do this is widely available. From low-code workflow platforms to advanced process mining solutions, there are more options than ever to automate reporting, capture telemetry at the source, and turn raw events into actionable insight. The opportunity isn’t just to measure more. It’s to measure smarter and free your teams from manual reporting so they can focus on improving the process instead of documenting it.
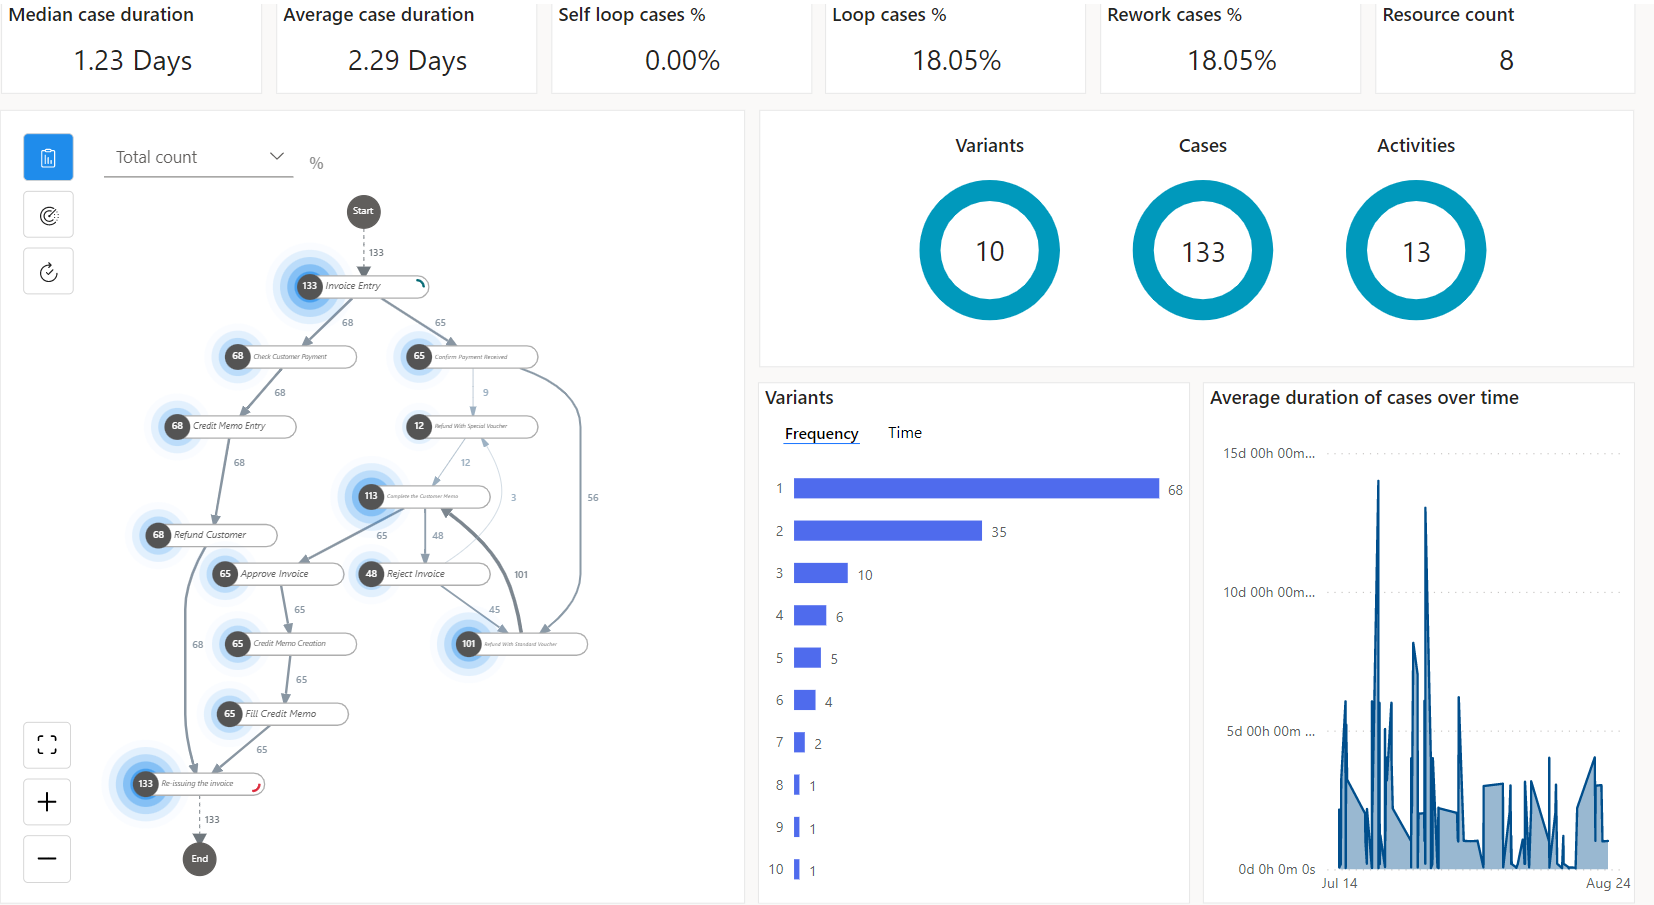
Figure 5: Working with Process Mining in Microsoft Power Automate
Chasing Ghosts: The Danger of Chasing Trailing Indicators
Walk into almost any sales status meeting and you’ll hear the same metrics discussed over and over again. Closed revenue. Quarterly bookings. Pipeline value. Win rate. Average deal size. Last month’s performance versus target.
None of these metrics are wrong. In fact, they matter. The problem is that they’re trailing indicators. They tell you what already happened.
Revenue reported this month reflects deals that were sourced, nurtured, negotiated, and approved weeks or even months ago. Pipeline gaps today often trace back to prospecting activity that didn’t happen two or three months prior. In many organizations, by the time leadership sees the red flags in a dashboard, the underlying issue is already 60, 90, or even 150 days old. At that point, you’re not managing the present. You’re explaining the past.
This is where the danger lies. Trailing indicators are comfortable because they’re easy to measure and universally understood. But they can create a false sense of control. You can debate the numbers. You can compare them to last quarter. You can hold people accountable for outcomes. What you can’t do is change what already happened.
If revenue is down this quarter, the root cause likely sits further upstream. Maybe business development representatives weren’t booking enough appointments. Maybe inbound campaigns didn’t generate enough impressions or clicks. Maybe conversion rates slipped earlier in the funnel and no one noticed. Those are leading indicators. They signal what’s about to happen, not what already did.
Leading indicators are often harder to track. They may require pulling data from calendars, marketing platforms, CRM activity logs, or campaign analytics. They may require more thoughtful analysis to separate signal from noise. But the data is there if you look for it. Appointment schedules can be analyzed for volume and consistency. Marketing impressions and click-through rates can be measured in real time. Pipeline creation velocity can be tracked weekly, not quarterly.
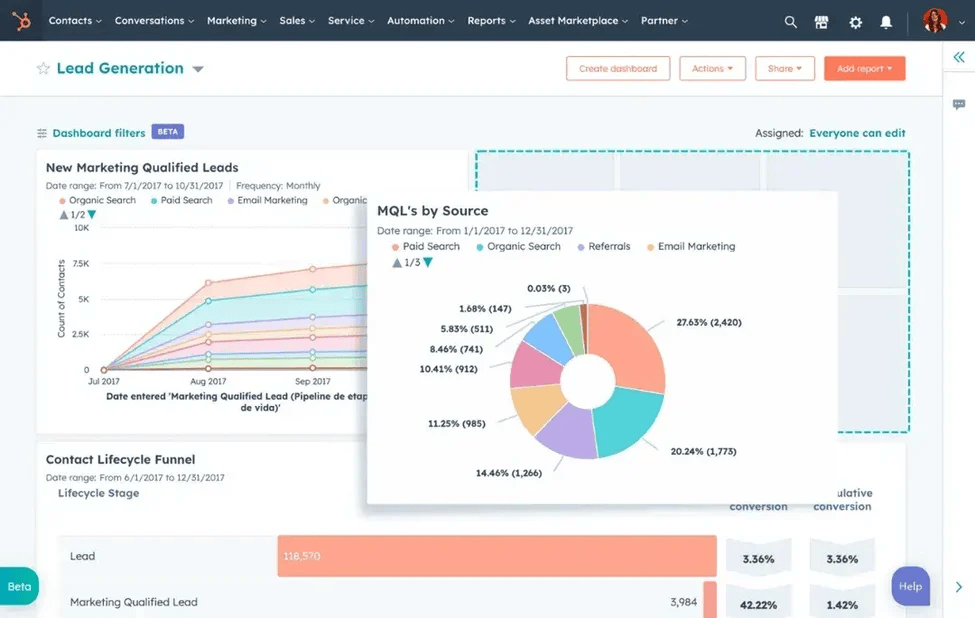
Figure 6: A HubSpot Dashboard Measuring Leading Indicators
Real-Time Intelligence: Moving from Reactive to Proactive
For most organizations, data flows in one direction. It’s captured. It’s stored. It’s reported on later. Decisions follow after the fact.
Real-time intelligence changes that model entirely.
Modern data platforms now make it possible to build what amounts to a digital nervous system on top of your operational data. Instead of waiting for someone to notice a problem in a report, the system itself can detect patterns, thresholds, and anomalies as they happen. Signals move immediately. Responses follow automatically.
For example, Microsoft Fabric Real-Time Intelligence allows you to stream and analyze data from operational systems, devices, applications, and event logs the moment it’s generated. But the real power comes from what happens next.
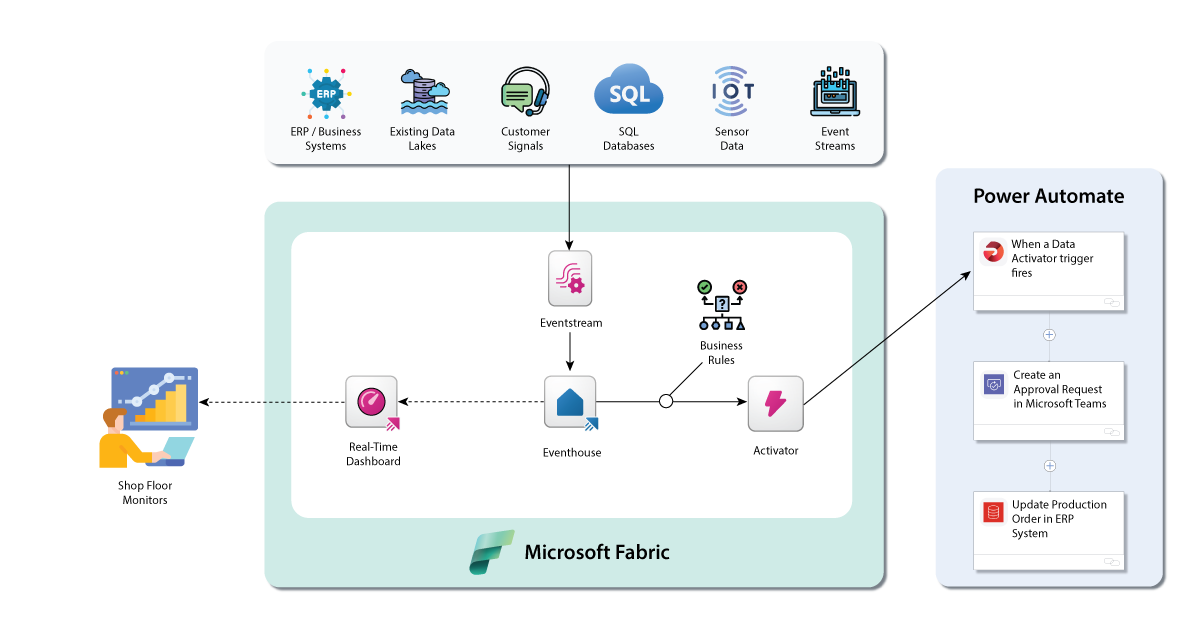
Figure 7: Building a Digital Nervous System Using Fabric Real-Time Intelligence
Enter the concept of a data activator and what you might think of as digital reflexes. As illustrated in Figure 7, a data activator continuously listens for specific conditions within your operational data. When a defined event occurs — a KPI drops below a threshold, a cycle time exceeds its target, inventory falls under a minimum level, or a pipeline metric slows — the system doesn’t just record the event for later review. It automatically triggers a predefined response.
Much like a biological reflex, the signal is detected, interpreted, and acted upon in near real time. Instead of waiting for someone to discover the issue in a dashboard or status meeting, the workflow responds immediately, reducing delay and preventing small issues from compounding into larger problems.
That response might be:
Sending an alert to a manager
Creating a task in a workflow system
Launching an approval process
Notifying a sales rep to follow up
Escalating a service issue before the customer complains
This is the shift from dashboards to reflexes.
Instead of relying on humans to constantly monitor reports and manually intervene, you define rules and workflows that proactively respond to data events. The system becomes aware. It listens. It reacts.
That doesn’t eliminate human decision-making. It elevates it. Leadership teams can focus on higher-level judgment and strategy because the routine monitoring and first-response actions are handled automatically. Problems are surfaced earlier. Bottlenecks are flagged in motion, not after the quarter closes. Performance gaps trigger corrective workflows before they compound.
The Answers Were There All Along
Data isn’t the solution to every problem. Leadership still requires judgment. Strategy still requires vision. But in today’s environment, data is the solution to far more problems than many organizations realize.
The information you need to improve performance, reduce waste, increase revenue, and respond faster to change is often already flowing through your systems. It lives in your ERP and CRM platforms, in process logs, documents, and operational workflows. The issue isn’t availability, it’s visibility. The data is there. It just needs to be refined, connected, and put to work.
Closing Thoughts
The modern business environment moves too quickly to rely on instinct alone, disconnected tools, or backward-looking reports. The organizations that win are not necessarily the ones with the most data. They’re the ones that can see it clearly, refine it thoughtfully, and respond to it in time to matter. From process telemetry and structured modeling to unstructured document analysis and real-time reflexes, the tools exist today to turn information into action.
The real question isn’t whether you have the data. It’s whether you’re willing to treat it as a strategic asset. When you do, you begin to close reporting gaps, eliminate blind spots, and empower your teams with clarity. You stop chasing ghosts. You stop reacting to history. And you start making decisions based on signals that have been there all along.