
I was having a chat with an accountant friend of mine the other day and listening to his tales of woe with Excel data wrangling. As he was stepping me through the number of steps required to produce an operations report each month, I was surprised to learn how much of this he was doing by hand.
Given the fact he is an Excel expert, I was equally surprised to discover that he had not heard of Power Query. After our conversation, I did a little asking around and found that this was actually a pretty common phenomenon. So, I decided to take to the blog-o-sphere and use our platform as America’s favorite tech blog to fight this injustice. Please, tell your friends. 🙂
What is Power Query?
According to Microsoft, Power Query is a “data transformation and data preparation engine”. Put simply, Power Query is a graphical tool that you can use to import, massage, and enrich data.
One of the great things about Power Query is that you can use it in a lot of places within the Microsoft landscape:
Starting with Excel 2016, Power Query is available directly within Excel.
Power BI developers can use it to perform ETL tasks or enrich datasets using the Power BI Desktop tool.
For industrial strength ETL/ELT workloads, you can also use Power Query to create data flows in Azure Data Factory (now Data Factory within Microsoft Fabric).
For those of you scoring at home, Power Query is built on the M programming language. So, while your mileage will vary slightly between these different environments, the nice thing is that once you start to learn your way around Power Query, you can basically use it anywhere.
Power Query: The Dime Tour
To demonstrate the power and benefits of Power Query, let’s see how we can use Power Query in Excel to automate some of those tedious tasks my accounting friend was lamenting in our virtual barstool discussion.
For my demonstration, I used some sample data files from Kaggle which you can download here. This dataset contains a series of CSV files containing some raw sales data (e.g., sales reps, sales territories, products, demographics, and sales targets). For the purposes of this exercise, let’s assume that these files are compiled by different departments within the organization and emailed to an analyst responsible for producing a monthly sales report.
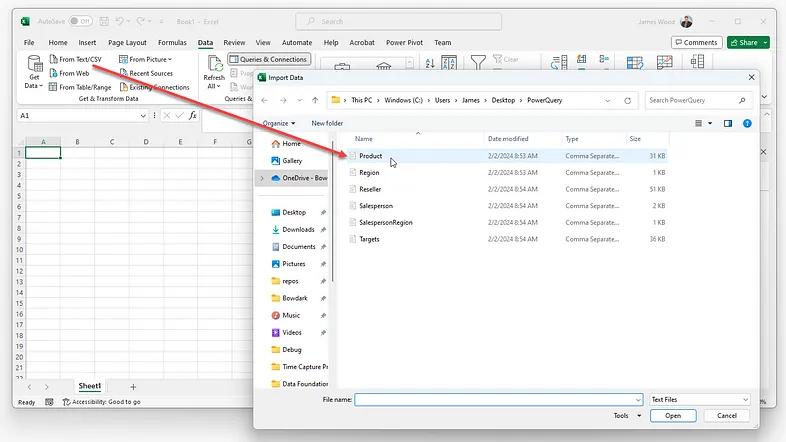
To import/wrangle this data in Excel, we can open up a new Excel file and go over to the Data tab. There, within the Get & Transform Data panel, you have various options for getting data. We’ll choose the From Text/CSV option here (see Figure 1), but we could just as easily pull in data from Excel, Access, external databases, and even external websites — Power Query can work with data from a lot of places.
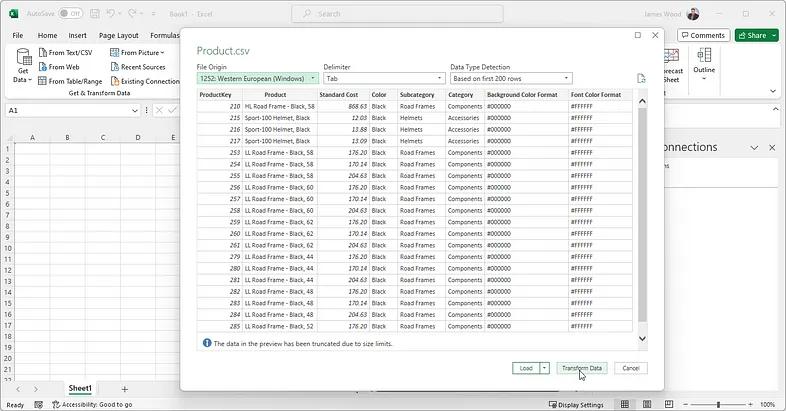
Once you select the source file, you’ll be presented with a data preview window like the one shown in Figure 2. If you want to jump right in and start massaging the data, you can select the Transform Data button. For our exercise, we’ll just select the Load button to upload the data and we can proceed with loading the reset of the source files.
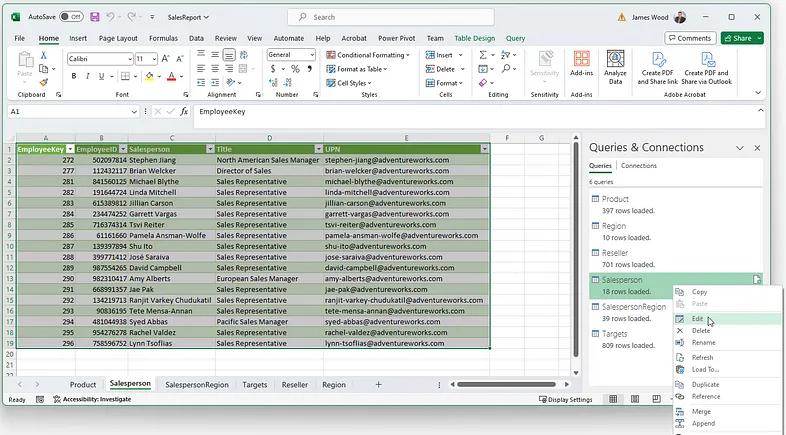
After the raw data files are loaded, we can start compiling our report by right-clicking on one of the datasets and choosing the Edit option as shown in Figure 3 below.
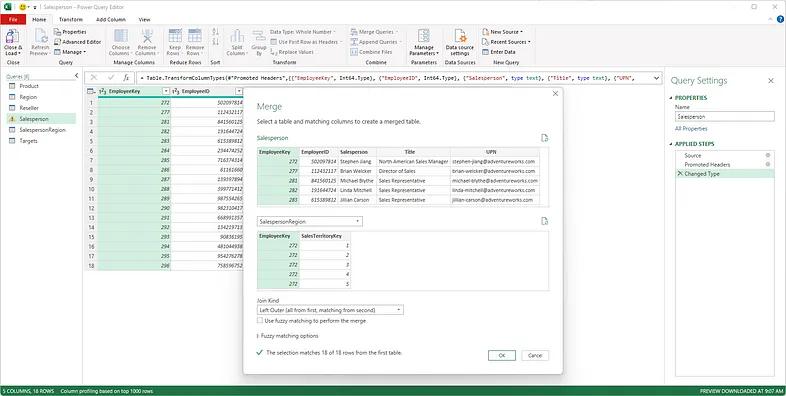
This will open up the Power Query editor tool shown in Figure 4 below. This editor is packed with all kinds of treasures for massaging data. Although we can’t do it justice in this space, here’s just a sample of some of operations supported by the tool:
Remove unneeded columns
Apply complex filters and/or remove duplicate rows
Sort/group the datasets by advanced criteria
Pivot tables/columns
Format data and clean up outlier values
Find/replace values
Apply complex mathematical calculations
Split columns
Create calculated columns
Join/merge datasets
To put these features to work, we’ll start by performing a merge query between the Salesperson and SalespersonRegion datasets, matching up on EmployeeKey. Using a Left Outer Join, we can easily pull in region/territory assignments for sales reps so that we have it all right there in front of us.
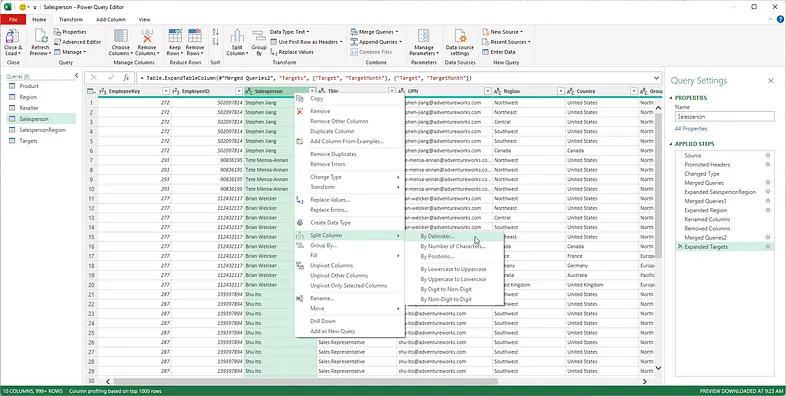
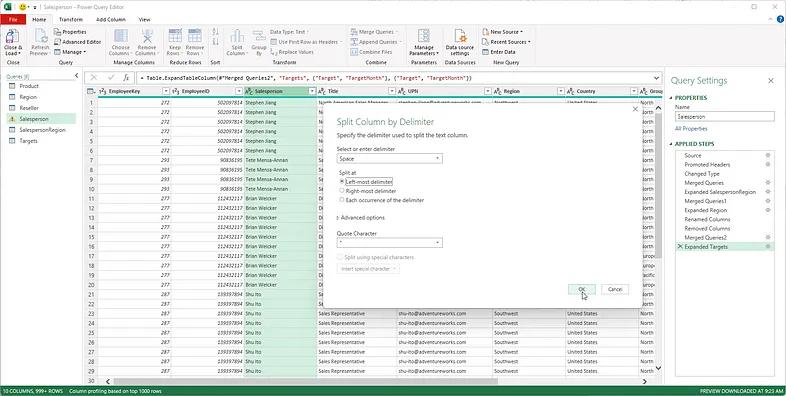
The next operation we’ll perform is to split the Salesperson name field into discrete first and last name values. For this, we’ll right-click on the Salesperson column and choose Split Column → By Delimitter…. Then, in the popup dialog box shown in Figure 6, we’ll select a space as our delimitter and split the columns.
The end result is shown in Figure 7 below. Here, we’ve taken the raw salesperson data and brought in information about their assigned territory and targets. We’ve also removed unneeded columns, massaged some fields (e.g. salesperson name), and applied some formatting.
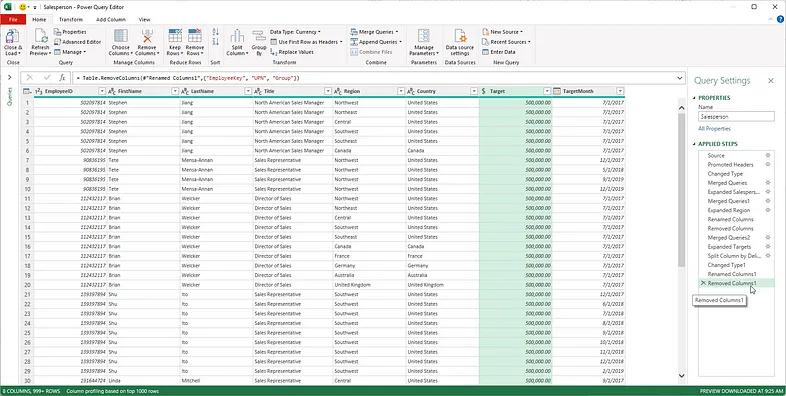
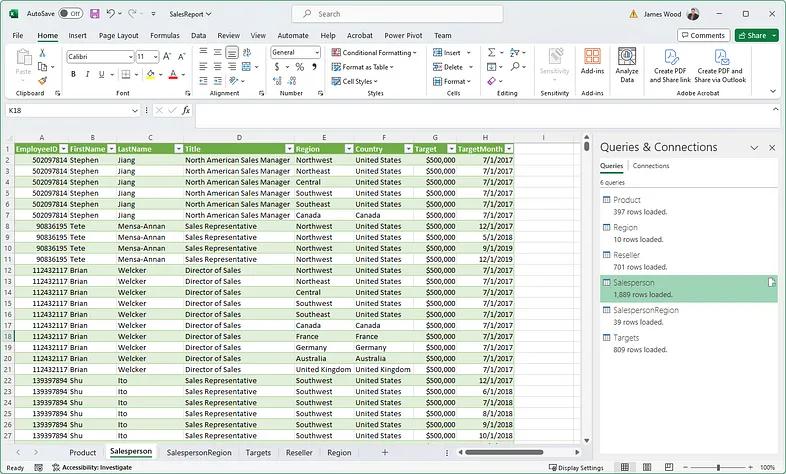
Figure 8 shows the finished result in Excel. This report is now ready to be sent out or, better yet, converted into a Power BI report that’s more easily shareable.
Why Power Query?
You might be thinking to yourself, “can’t we basically do all this stuff using regular Excel functions?” The answer is yes and no. The Power Query engine supports more advanced features and can apply these operations at scale to larger datasets.
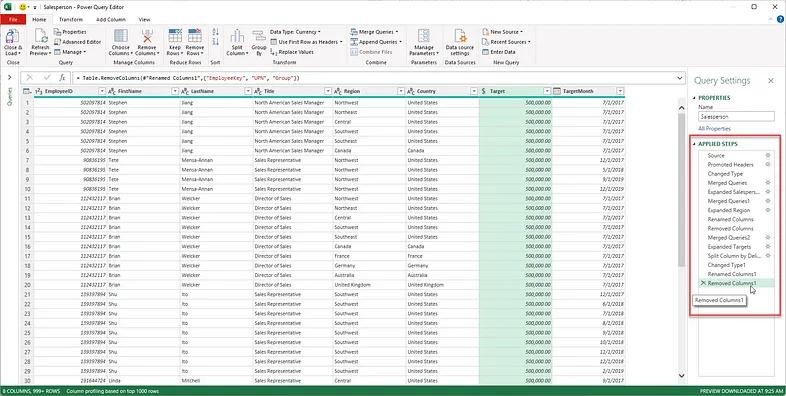
However, the real reason for why you would want to do this in Power Query is right there in the query editor. As you can see in Figure 9 below, each change we make to datasets — no matter how large or small — is recorded as an applied step in the Power Query macro recorder that’s responsible for building our M code. This has some huge implications:
It means that our hard work in massaging these files is recorded in repeatable source code.
We can refine/backtrack our changes over time as data issues crop up.
We can parameterize these steps/code to create jobs that can repeat this logic against new sets of files.
Although our contrived example may not seem that exciting, imagine if you were working with dozens of spreadsheets that required many hours of refinement. Then, imagine that you had to repeat these tasks by hand each month as new source files come in.
With Power Query, all that goes away. For example, we could create a master Excel sheet and upload it to OneDrive. Then, instead of emailing files around, we could share a link to the folder where this spreadsheet lives and ask our coworkers to upload their raw data files to that share each month. That way, whenever the Excel file is opened, it always pulls from the latest and greatest versions of the source files, repeats our encoded steps, and generates the latest version of the report on demand.
Of course, we can accomplish much more advanced things with Power BI and some magic from our Power Automate process specialists, but that’s a story for another time.
Closing Thoughts
I hope you enjoyed this little foray into the world of Power Query. And, if you’re like my accountant friend living in Excel hell, maybe you found a shiny new tool to add to your tool bag.
However, the bigger take-away that I’d like to leave with you is that tools like Power Query are just the tip of the iceberg in terms of what Microsoft is delivering with their intelligent data platform (now known as Microsoft Fabric). This democratization of data tools is unlocking efficiencies on an unprecedented scale — so I’d highly encourage you to check it out. Thanks for reading!